
 Observia Editorial Team
Here’s a number that tends to stop people mid-scroll: U.S. employers pay over $1 billion every week in direct workers’ compensation costs for disabling, non-fatal workplace injuries. That’s according to Liberty Mutual’s 2025 Workplace Safety Index.
And that figure only covers direct costs. The National Safety Council puts the total economic burden of work-related deaths and injuries at nearly $1.2 trillion in 2022 when you factor in lost productivity, employer costs, and wage losses.
For operations managers, CFOs, and EHS leaders trying to hold margins together, these aren’t industry-wide abstractions. They show up on your P&L as rising premiums, higher deductibles, and tighter cash flow. The question worth asking isn’t whether your premiums are too high. It’s whether the conditions that drive them up are still going unaddressed.
The Real Cost Isn’t Just the Premium
Workers’ compensation insurance costs U.S. businesses an average of $1,128 per employee per year. For companies in construction, manufacturing, logistics, or warehousing, that number can climb significantly higher depending on risk classification and claims history.
But the direct premium is only the starting point. Behind every workplace injury sits a cascade of costs that rarely show up on the insurance bill.
The National Safety Council estimates the average workplace injury costs over $40,000 in direct expenses alone. Layer on overtime pay for replacement workers, production delays, investigation time, regulatory fines, and potential litigation, and the real cost per incident can be several times that figure.
OSHA Serious Violations
Carry Heavy Fines
Occupational Safety & Health Administration
Repeated violations increase scrutiny, trigger additional inspections, and create a compounding cycle of exposure. High injury rates also erode workforce morale. Employees who feel unsafe disengage, turnover rises, and the resulting churn brings in inexperienced workers who are statistically more prone to injury.
This is the cycle that inflates premiums year after year. Not the premium itself, but the conditions underneath it.
What’s Pushing Premiums Up Right Now
Several converging forces are making workers’ compensation more expensive heading into 2025 and 2026.
Medical inflation is accelerating. Employer-sponsored health care coverage costs are increasing by roughly 9% in 2025, exceeding $16,000 per employee. The Centers for Medicare and Medicaid project health care spending will rise by 5.4% annually through 2028. Every increase in treatment cost flows directly into claim severity and, eventually, premium calculations.
Wage growth is raising the exposure base. Workers’ compensation premiums are calculated per $100 of payroll. As businesses raise wages to attract and retain workers, their premium base grows proportionally, even without any change in incident rates. Indemnity claims, which cover lost wages during recovery, also increase alongside wage growth.
Workforce demographics are shifting. Multiple states have seen a larger share of both new and aging employees in high-risk roles. The Bureau of Labor Statistics projects the share of workers aged 75 and older in the labor force will grow by 96.5% over the next decade. New workers lack institutional safety knowledge. Older workers face different physical risk profiles. Both demographics elevate exposure without necessarily increasing headcount.
State-level rate adjustments are returning. California is implementing its first major pure premium rate increase in a decade, effective September 2025. Colorado insurers have requested 13.6% higher premiums for small employers. Washington State approved a 3.8% average rate increase. These aren’t isolated events. The NCCI’s 2025 State of the Line Report notes that nationwide indemnity costs are trending higher.
None of these forces are within your direct control. What is within your control is the one variable that insurers weigh most heavily when calculating what you specifically pay: your claims history.
The Pattern Behind the Premium
Insurance premiums don’t rise randomly. They rise because the conditions that produce claims haven’t changed. Medical inflation, wage growth, and regulatory shifts add external pressure. But the variable you control, the one insurers use to calculate what you specifically pay, is your safety record.
The organizations that are seeing their premiums stabilize or decline are the ones that have moved beyond periodic compliance checks. They track leading indicators continuously. They identify the small, habitual behaviors that compound into recordable incidents. They act on patterns before those patterns appear on an OSHA 300 log.
Most incidents start as patterns. Most premiums start as unaddressed risk. The question is when you see them.
Your EMR Is the Number That Matters Most
If you run a mid-size or large operation, your Experience Modification Rate (EMR) is the single most influential factor in your workers’ compensation premium. It compares your company’s actual claims history against expected losses for businesses of similar size, industry, and location.
An EMR of 1.0 means your claims experience matches the industry average. Below 1.0 means you’re performing better, and your premium drops accordingly. Above 1.0 means you’re performing worse, and you pay more.
The math is straightforward. If your base premium is $100,000 and your EMR is 1.25, you’re paying $125,000. A competitor with the same base premium and an EMR of 0.85 pays $85,000. That’s a $40,000 difference in annual insurance costs for the same coverage, driven entirely by safety performance.
The gap compounds over time. EMR calculations use three years of claims data, excluding the most recent year. One bad year can inflate your premiums for three consecutive years. And in industries like construction, government contracting, and manufacturing, clients routinely check EMR before awarding contracts. An EMR above 1.0 can disqualify you from bids entirely.
OSHA has stated that employers who establish effective safety and return-to-work programs can reduce costs related to workplace illness and injury by up to 35%. Industry data suggests that AI-powered safety technology can help employers lower workers’ compensation claim expenses by up to 45%. These aren’t promotional claims. They reflect the direct relationship between incident frequency and what insurers charge you.
Here’s the part that matters: insurers weigh claim frequency more heavily than claim severity. Ten small claims will damage your EMR more than one large one. This means the pattern of recurring minor incidents, the PPE misses, the near-misses, the small ergonomic strains, are quietly inflating your premiums more than any single catastrophic event.
The Hidden Premium Driver: Undetected Patterns
Most companies have safety programs. They run audits. They train employees. They document procedures. And yet, according to the Bureau of Labor Statistics, U.S. employers still reported 2.5 million nonfatal workplace injuries and illnesses in 2024. Over 5,070 workers died on the job that year.
The gap between having procedures and having visibility into what actually happens on the floor is where premiums quietly escalate.
Consider the safety pyramid that EHS professionals use as a foundational model. At the top sit fatalities. Below that, lost time injuries (LTI), restricted work cases (RWC), medical treatment cases (MTC), first aid cases (FAC), and near-misses (NM). At the very base are unsafe acts and unsafe conditions (UA/UC).
Traditional safety management focuses on the top half of that pyramid. Incident investigations, root cause analysis, corrective actions, all triggered after something has already happened. These are lagging indicators. They tell you what went wrong. They do not prevent the next occurrence.
The base of the pyramid is where premiums are actually built. The worker who enters a restricted zone without a hard hat three times a week. The forklift operator who consistently exceeds speed limits during shift changes. The repeated instances of improper lifting posture near conveyor pinch points. Each of these is an unsafe act that, left unaddressed, compounds into a recordable incident, a claim, and an EMR increase.
The challenge is that these patterns are nearly impossible to catch through periodic audits. A safety walk-through once a week captures a snapshot. It doesn’t capture the frequency, timing, or distribution of the behaviors that create risk.
Where Proactive Monitoring Changes the Math
This is where the conversation about insurance premiums connects directly to how safety is monitored.
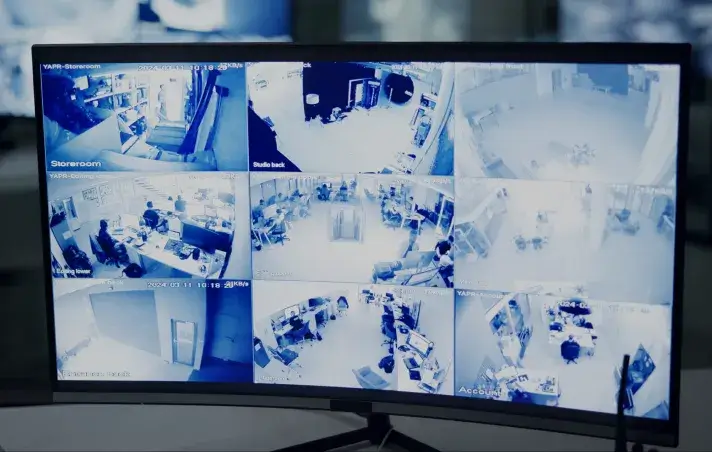
Computer vision systems designed for behavioral safety monitoring do something audits can’t: they observe continuously. Not once a week. Not during scheduled inspections when everyone is on their best behavior. Around the clock, across shifts, in real time.
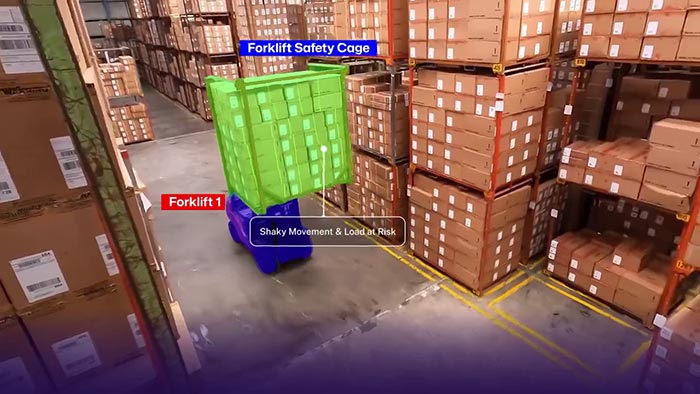
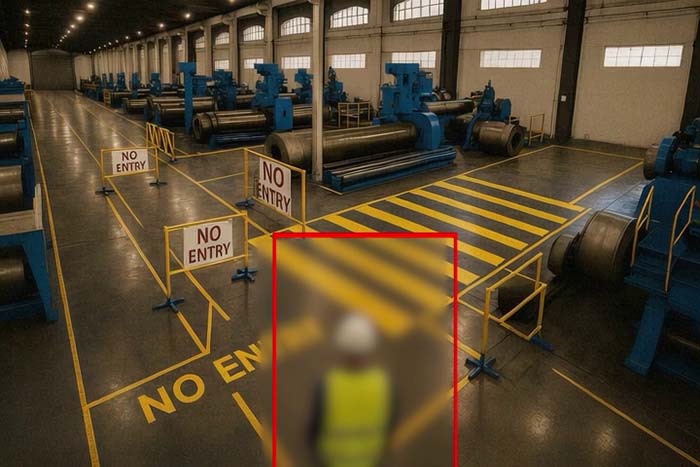
These systems detect PPE non-compliance, unauthorized zone entry, unsafe ergonomic postures, near-miss events, and traffic violations like forklift speeding or improper docking procedures. They surface leading indicators, the predictive signals at the base of the safety pyramid, before those signals become the lagging indicators that drive up your EMR.
Recommended Read – 2026 PPE Detection Softwares Showdown: How Top AI Platforms Compare
The value isn’t in catching people doing something wrong. It’s in identifying the patterns that compound over time. When an EHS team can see that PPE violations spike during a specific shift, or that near-misses cluster around a particular intersection on the shop floor, they can act on the root cause before it produces a recordable incident.
This is the difference between reactive compliance and proactive risk management. One waits for the claim. The other works to make sure the claim never happens.
Companies that have adopted AI-driven safety monitoring in logistics, manufacturing, and construction have reported measurable reductions in workplace incidents.
One logistics operation saw a 25% drop in incidents after implementing behavior analysis tools. Construction firms using real-time hazard detection have reported reductions of 40% to 50%. These outcomes translate directly into fewer claims, lower EMRs, and reduced premiums.
Five Ways High Premiums Are Quietly Damaging Your Business
The financial impact of inflated insurance costs extends well beyond the line item on your balance sheet.
Margin erosion on every project. In industries like construction and manufacturing, workers’ compensation is factored into bid pricing. A higher EMR means higher overhead on every proposal. You either absorb the cost and lose margin, or pass it through and lose competitiveness.
Lost contract eligibility. Many general contractors and project owners require subcontractors to carry an EMR below 1.0. If your safety record pushes you above that threshold, you’re excluded from bidding before the conversation even starts. This is revenue you never see because the door closed before you could walk through it.
Cash flow pressure. Workers’ compensation premiums are typically calculated against payroll. As wages rise, so does the premium base. When combined with a high EMR, the annual cost can create meaningful cash flow strain, particularly for small and mid-size employers. Seasonal businesses feel this acutely when premium payments don’t align with revenue cycles.
Talent attrition and recruitment costs. Workplace safety consistently ranks among the top criteria employees consider when evaluating job offers. A poor safety record, reflected in a high EMR, signals a work environment where injuries are common. That perception affects retention, recruitment, and the overall quality of the workforce you’re able to attract.
Regulatory exposure. An EMR above 1.25 can trigger increased scrutiny from OSHA and state regulators. This may include targeted inspections, additional compliance requirements, and a cycle of enforcement that diverts management attention from operations.
What You Can Do About It
Reducing your insurance premiums isn’t a one-quarter initiative. It’s the outcome of consistently reducing the conditions that generate claims. Here are the levers that matter most.
Audit your EMR and understand what’s driving it. Review your claims data from the past three years. Identify whether frequency or severity is the bigger factor. If you’re seeing a pattern of frequent small claims, that’s a behavioral safety issue, not a procedural one.
Shift focus from lagging to leading indicators. Track metrics like unsafe acts observed per shift, PPE compliance rates by zone, near-miss frequency, and ergonomic risk observations. These leading indicators predict your future EMR more reliably than your current TRIR or LTIR.
Invest in continuous monitoring, not just periodic audits. Annual or quarterly audits capture a fraction of the picture. The behaviors that generate claims happen between audits, during shift changes, overnight operations, and peak production periods when supervision is stretched thin.
Close claims efficiently. Open claims carry reserve amounts that inflate your EMR until they’re settled. Working with your insurer and broker to close claims promptly, with appropriate return-to-work programs, can directly improve your modification rate.
Treat safety as an investment, not an expense line. Every dollar spent on preventing an incident returns multiples in avoided claim costs, premium reductions, and retained contract eligibility. OSHA’s data consistently shows that effective safety programs reduce injury-related costs by up to 35%.
Observia AI monitors behavioral safety through computer vision, helping EHS teams detect unsafe acts, PPE violations, and near-misses before they become recordable incidents. Learn how proactive safety monitoring reduces the conditions that drive up your premiums at observia.ai.